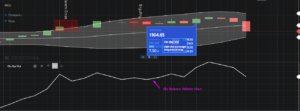
The On-Balance Volume (OBV) indicator is a technical indicator used to measure the overall buying and selling pressure of an asset based on its trading volume during specified time period. The underlying theory of OBV is that changes in volume often precede price changes, making it useful for identifying potential trend reversals and confirming ongoing up or down trend.
How OBV Works:
On-Balance Volume calculates a running total of volume, adjusting the volume based on whether the asset’s closing price moved up or down compared to the previous period. It assumes that volume is a key driver of price movements:
- When the closing price is higher than the previous period, the day’s volume is added to the OBV.
- When the closing price is lower than the previous period, the day’s volume is subtracted from the OBV.
- When the closing price is unchanged, the OBV remains the same.

OBV Calculation:
-
- If the current closing price is higher than the previous day’s close:
-
- OBV=Previous OBV+Volume of the day
-
- If the current closing price is lower than the previous day’s close:
- OBV=Previous OBV−Volume of the day
- If the closing price is unchanged:
-
- OBV=Previous OBV
-
- If the current closing price is higher than the previous day’s close:
Key Uses of OBV:
- Trend Confirmation: OBV is mostly used to confirm the strength of a trend. If OBV is rising while prices are also rising, it confirms a bullish trend. If OBV is falling while prices are also falling, it confirms a bearish trend.
- Breakouts: A sudden surge in OBV can suggest a breakout in either direction, which could indicate the start of a strong trend in the direction of the OBV movement.
Example of On-Balance Volume Calculation:
Let’s say you are tracking a stock over five days with the following data:
- Day 1: Close = 100, Volume = 10,000
- Day 2: Close = 102, Volume = 12,000
- Day 3: Close = 101, Volume = 8,000
- Day 4: Close = 103, Volume = 15,000
- Day 5: Close = 104, Volume = 20,000
Using OBV:
- Day 1: OBV = 0 (At the beginning)
- Day 2: OBV = 0 + 12,000 = 12,000 (close higher)
- Day 3: OBV = 12,000 – 8,000 = 4,000 (close lower)
- Day 4: OBV = 4,000 + 15,000 = 19,000 (close higher)
- Day 5: OBV = 19,000 + 20,000 = 39,000 (close higher)
The rising On-Balance Volume suggest that buys are heavily participating in asset, it indicate that the price trend may continue upward.
One should also consider some other indicators to support a downtrend or uptrend; some of the widely used such indicators are listed below.
1 Golder cross OR Death cross
2 Moving Average Convergence Divergence (MACD)
3 Relative Strength Index (RSI)
4 Stochastic Oscillator
Feel free to share your thoughts on On-Balance Volume (OBV) indicator or ask any questions in the comments below. Your feedback helps us improve, and we’re here to clarify any points you may have!
